












Contents
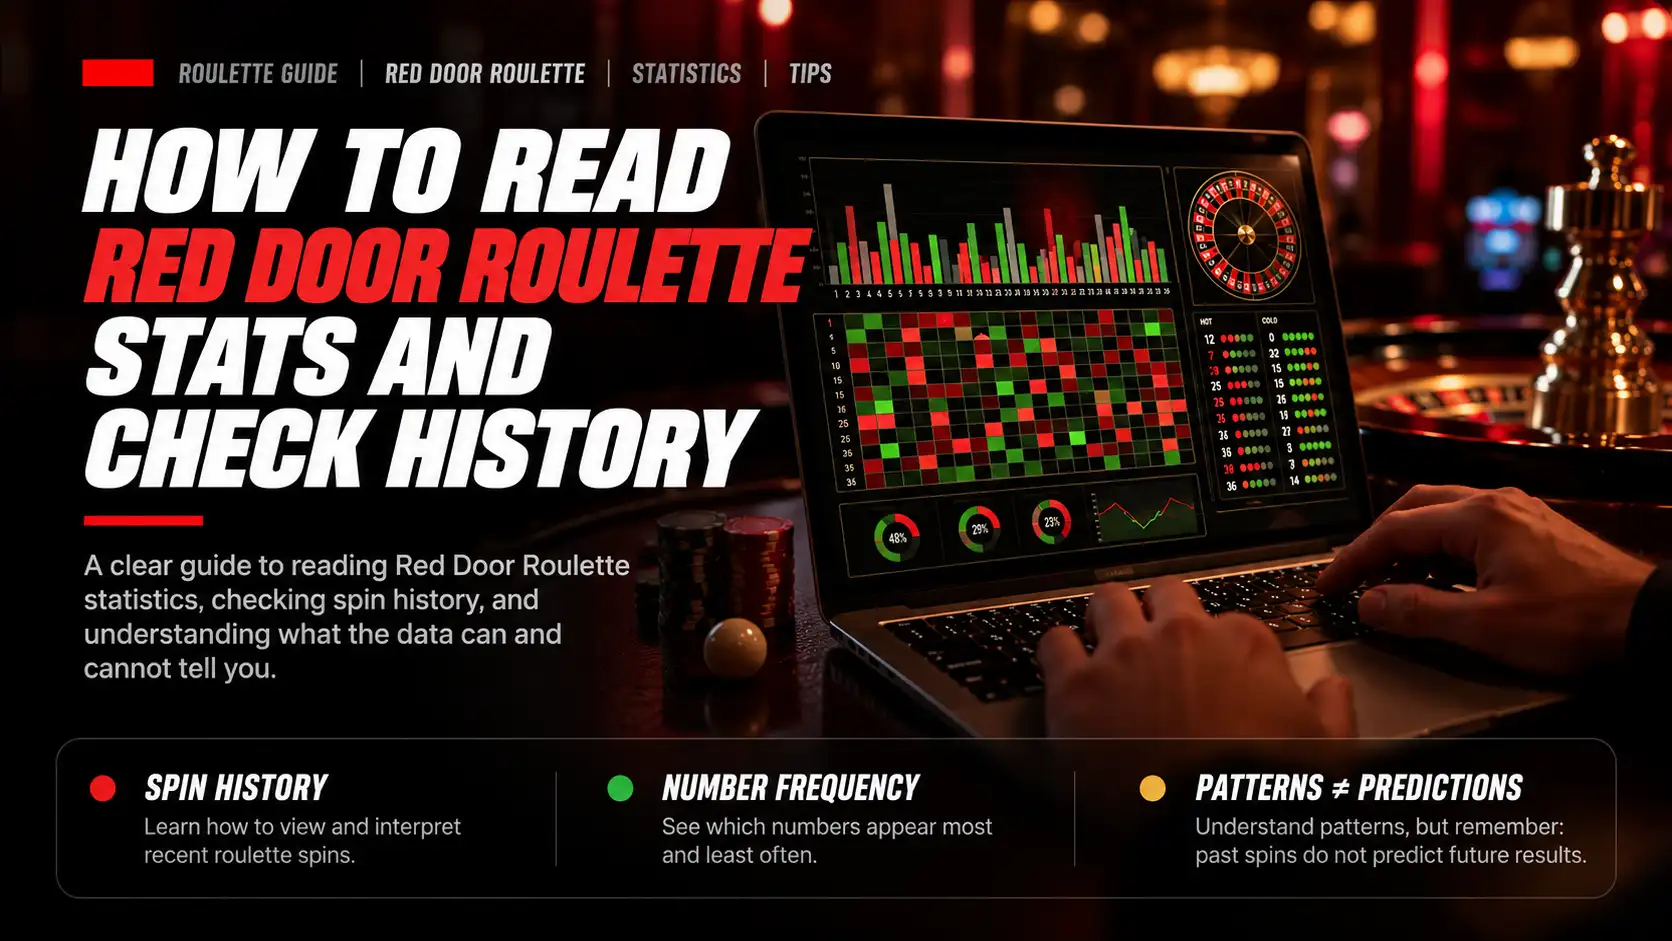
You can find Red Door Roulette results on external statistics pages and check your own accepted bets in the game client’s history. This page provides a manual analyzer, not a live stream or table feed. It shows frequencies and group distributions for the winning numbers you enter; it does not predict the next spin.
Stats describe what happened in a selected sample. Hot and cold numbers, color frequencies, gaps and bonus matches only make sense alongside the source, sample size and time window. None means that a number is “due.”
Where to find results and which source to use
Use an external results page for a public table log, the game client’s history to check your own bets, and the analyzer below to examine a sequence you already have. These sources serve different purposes and have different limits.
| Source | Available information | What to check |
|---|---|---|
| CasinoScores | Time-window controls for 1, 6, 12, 24, 48 and 72 hours | This is an English-language page. Elapsed hours do not tell you the number of completed spins |
| GamblingCounting | Frequency windows of 250, 500 and 1000 spins; the last 200 results | The frequency window may exceed the available results log. A Russian-language page is also available |
| Spinlytics | A 24-hour round table with time, result, multiplier, payout and winners | Mixed languages and variant labels appear, so confirm the specific table |
| Game client history | Records of your accepted bets and their settlement | It is not necessarily a log of every public spin; rounds without your bet may be absent |
| ToolsGambling analyzer on this page | Winning-number frequencies, colors, even/odd, high/low, dozens and three sectors | Input is manual; there is no automatic results feed |
This is a functional comparison, not a ranking of accuracy or update speed. A results table does not establish that its data is free of delays, missing rounds or matching errors.
How to check history before counting
First confirm that the records cover the same table and window, then remove duplicate records and flag gaps. Otherwise, even a correctly calculated frequency may describe the wrong sample.
- Confirm the game and table. Record Evolution, the Red Door Roulette name, the game variant and the table identifier when available. A similar page title is not enough.
- Record the window. Note the source, time zone, start and end, and number of completed spins
N. For a rolling last-spins window, record its size and when you checked it. - Compare several completed rounds. Where two sources are available, compare round IDs, times and winning numbers. The same number can appear repeatedly, so a matching number alone does not identify a round.
- Remove duplicates by round ID, not winning number. Two results of 13 can be two valid spins. Without an ID, use time and context, and retain a note about the uncertainty.
- Log gaps. Do not fill unknown rounds with zero: zero is a genuine roulette result, not a missing-data marker.
- Separate completed rounds from pending bonuses. The winning number may be known before the final bonus multiplier or payout is settled.
- Check settlement status for financial calculations. Record how cancelled rounds, void bets and refunds are handled rather than mixing them into ordinary settled bets.
If sources disagree, keep the round ID, time, window, source and disputed record. Check the original client history and contact support if needed. A mismatch between third-party tables is not, by itself, evidence of fraud.
Page 10 of the Red Door Roulette rules dated 18 April 2024 describes game history. Its “GAME NUMBER” label and GMT reference belong to that historical document; current labels and time displays may differ.
Original English Red Door Roulette rules fragment about game history
Original English rules fragment, dated 18 April 2024, page 10. It documents the interface described at that time, not necessarily today’s interface.
What the statistics mean
Frequency, or hit rate, is the number of hits divided by the number of completed spins in the selected sample. Other metrics also describe that window rather than forecast the next result.
| Metric | Meaning | Limit |
|---|---|---|
| Winning number | The main spin’s result, from 0 to 36 | Does not alone reveal a payout or your bonus entry |
| Hot and cold numbers | Numbers with higher or lower sample frequencies, h/N | Do not become more or less likely on the next independent spin |
| Gap | Past spins without a number appearing | Measures past absence, not whether a number is due |
| Observed group hit frequency | Share of sample results in a color, dozen, column or sector: h/N, where h is the number of hits and N is the number of results | Requires the correct group membership and treatment of zero |
| Bonus matches | M/N, where M is completed rounds won by a keyed number | Not the same as personal bonus-entry probability |
| Key multiplier | A value associated with a keyed number | Must not automatically be treated as the final bonus multiplier |
| Final bonus multiplier | The settled multiplier after the bonus, under the version’s rules | Cannot be replaced by an intermediate value |
| Total payout | Payouts within the source’s stated scope | Not an individual player’s profit |
The following baselines assume 37 equally likely numbers and independent events. Those are calculation assumptions, not findings about a checked table.
| Number or group | Number coverage | Baseline frequency |
|---|---|---|
| One preselected number, including zero | 1/37 | 2.70% |
| Each color, even/odd group, or 1–18/19–36 group | 18/37 | 48.65% |
| Each dozen or column | 12/37 | 32.43% |
| Voisins du Zero | 17/37 | 45.95% |
| Tiers du Cylindre | 12/37 | 32.43% |
| Orphelins | 8/37 | 21.62% |
| Zero Spiel | 7/37 | 18.92% |
Zero counts toward N, but belongs to neither color, neither even/odd group, and no dozen or column. Consequently, the two color frequencies or three dozen frequencies need not add up to 100%.
Voisins du Zero, Tiers du Cylindre and Orphelins partition all 37 numbers into three non-overlapping groups. Zero Spiel overlaps Voisins du Zero; it is not a fourth separate part of that partition. Sector coverage is not the expected monetary return of a racetrack bet: stake allocation and payout rules are separate matters.
How to use the manual analyzer
Paste a sequence of winning numbers and check the spin counter. Results update automatically, with no calculate button, and the practice exercise requires no account, deposit or real bet.
Enter whole decimal numbers from 0 to 36, separated by commas, spaces, semicolons or line breaks. Invalid tokens are silently ignored, so always compare the counter with your expected N. Keep repeated winning numbers when they represent separate rounds.
Use Clear to empty the input. Reset restores the 34 default numbers; it does not empty the field or reload casino history.
Before using the widget: despite “Live” in its title, this is a manual analyzer. Its reading note’s fixed 1.5% threshold and suggestion that sector or color counts certify fairness are incorrect. Sampling variation depends on sample size, and frequency counts cannot certify a wheel.
Treat the output only as a description of your input. Neither a deviation below 1.5% nor colors or sectors close to their baselines establishes fairness. A larger deviation alone does not establish a problem either.
The tool shows colors, even/odd, high/low, dozens, three sectors, and five-number hot and cold lists. It has no table feed, API connection or live data. It does not calculate key matches, bonuses, payouts, expected value, theoretical RTP, columns, Zero Spiel or absence streaks. It has no history persistence or export.
The order of tied hot numbers is not meaningful. Zero-hit numbers are omitted from the hot list; cold-list ties are ordered by number.
Repeat the 40-spin practice sequence
Paste 0 through 36 followed by 13, 13 and 0: the counter should show 40 spins. This is an intentionally constructed teaching example, not observed casino play.
0,1,2,3,4,5,6,7,8,9,10,11,12,13,14,15,16,17,18,19,20,21,22,23,24,25,26,27,28,29,30,31,32,33,34,35,36,13,13,0
Select Clear, paste the full sequence and verify the counter. The three screenshots below are actual captures of the English interface running locally. Each uses the same constructed 40-number example without changing any parameters: 0 through 36, followed by 13, 13 and 0. They do not verify the production site or show casino play.
Manual analyzer input containing the constructed 40-spin sequence
Input: 0 through 36, then 13, 13 and 0. Expected sample size: 40.
| Result | Hits | Frequency |
|---|---|---|
| 13 | 3 | 7.50% |
| 0 | 2 | 5.00% |
| Every other number | 1 | 2.50% |
No number has zero hits in this example. The cold list contains numbers with the lowest frequency, not necessarily numbers that never appeared.
Hot and cold number frequencies for the same constructed 40-spin sample
13 has a frequency of 7.50%, zero 5.00%, and every other number 2.50%.
For 13, the difference between 7.50% and the rounded 2.70% baseline is 4.80 percentage points. That means subtracting one percentage from another, not a relative increase of 4.80%. The interface’s difference badge shows percentage points against the rounded baseline.
| Group | Hits | Frequency |
|---|---|---|
| Red | 18 | 45% |
| Black | 20 | 50% |
| Zero | 2 | 5% |
| First dozen | 12 | 30% |
| Second dozen | 14 | 35% |
| Third dozen | 12 | 30% |
| Voisins du Zero | 18 | 45% |
| Tiers du Cylindre | 14 | 35% |
| Orphelins | 8 | 20% |
The dozen rows leave 5% for zero. The three sectors already include zero within Voisins du Zero, so their frequencies total 100%.
Color, dozen and sector results for the same constructed 40-spin sequence
The same sample’s group results. The interface uses two decimal places for number frequencies, one for group values and two for baselines. These are display-rounding differences, not different input data.
How sample size affects frequencies
A larger sample reduces the typical random spread of frequencies under an independent model, but does not predict the next spin. There is no universal deviation threshold for every number, group and sample size.
For a group with probability p, the standard deviation of its observed frequency is:
sqrt(p × (1 − p) / N) × 100 percentage points
This follows from the binomial model described by NIST. Here, N is the number of independent completed spins and p is the assumed hit probability.
| Outcome examined | Sample size | Frequency standard deviation |
|---|---|---|
| One preselected number | 100 | 1.62 percentage points |
| One preselected number | 313 | 0.92 percentage points |
| One preselected number | 1000 | 0.51 percentage points |
| One dozen | 313 | 2.65 percentage points |
| One color | 313 | 2.83 percentage points |
These rounded values describe model spread. They are not acceptance intervals, fairness tests or guarantees that results stay within a “plus or minus” range. A confidence interval requires a separately specified method.
If you inspect all 37 numbers and then pick the hottest, you cannot interpret its deviation as though you tested only one preselected number. Nor do 1000 spins guarantee frequencies that exactly match the baselines.
What a long absence means
A preselected number can remain absent for a long window even under a uniform independent model. Its absence does not increase its chance on the next spin.
With probability 1/37 per spin, the chance of no hits in a predetermined window of N spins is (36/37)^N. This calculation applies to one fixed number and a window selected in advance, not all 37 numbers together or the longest gap found after inspecting history.
| Predetermined window | Probability of no hits |
|---|---|
| 50 spins | 25.41% |
| 100 spins | 6.46% |
| 200 spins | 0.42% |
| 313 spins | 0.019% |
The table rounds the probabilities to 25.41%, 6.46%, 0.42% and 0.019%. The last is approximately 0.02%, not zero. The chart retains the more precise values. The horizontal probability axis uses logarithmic spacing so that even tiny nonzero probabilities remain visible. Compare the actual numbers in the chart and table: bar lengths do not represent linear proportions of the probabilities.
A rare event does not prove wheel bias, and this formula does not establish a source’s fairness. Under independence, the next-spin probability remains 1/37. Expecting a long absence to require an imminent compensating hit is the gambler’s fallacy.
How bonus matches differ from personal bonus entry
A bonus-match frequency counts rounds won by a keyed number, not players entering the bonus. Personal entry requires an accepted winning straight-up bet on that exact keyed number.
The Evolution description and game rules distinguish this qualifying bet from other bet positions. A split, dozen or other group bet alone does not qualify. A neighbor bundle may place straight-up chips; a qualifying chip on the exact winning keyed number can meet the entry condition.
For a log, calculate M/N, where M counts completed spins whose winning number had a key. Do not substitute the number of winners, total assigned keys or bonus-wheel respins, including Double respins. An illustrative 40 matches in 200 completed spins gives 20% for that invented window only, not an observed casino rate or next-spin forecast.
If you explicitly assume a uniform winning number, independently and uniformly assigned K distinct keys, and one straight-up number selected before the outcome, the calculations differ:
| Event under those assumptions | Probability | Hypothetical K = 9 |
|---|---|---|
| The winning number has a key | K/37 | 24.32% |
| One preselected number wins and has a key | K/(37 × 37) | 0.6574% |
The second row also requires an accepted bet and compliance with the version’s entry conditions. Nine keys is a scenario parameter, not an established average or usual count. A range of 3–15 keys does not supply the weights needed to calculate a mean.
A key multiplier, an intermediate bonus-wheel multiplier and the final bonus multiplier represent different stages. Check the source’s labeling convention against the actual version’s rules. Selected top multipliers cannot reveal a typical reward, minimum payout or rare-event rate. See the Red Door Roulette bonus-round walkthrough for the stages.
Why payouts cannot be calculated from number frequencies
Financial results require all paid stakes and final gross settlements for the same rounds. Winning numbers, maximum multipliers or a public total payout without the stakes cannot establish a returned share.
Gross return must include returned winning stakes, while total stakes must include both winning and losing bets within the selected scope. Subtract all round stakes from gross return to obtain the net round result.
For example, 100 staked and 85 returned gives an observed returned share of 85% and a net result of −15. This is a loss, not profit. The example is illustrative, not a forecast or a player’s observed record.
An observed returned share is not theoretical RTP, nor does it establish the house edge. A public payout total across players also does not reveal your personal profit. The RTP and house-edge guide explains the distinction.
What you can conclude from checked history
Checked history can describe frequencies and gaps within a window, while complete financial records can show your result for that period. Neither provides a reliable signal for the next number, bonus or multiplier.
The practical workflow is to choose a source, confirm the table and window, remove duplicate records, flag gaps, verify N, and then compare frequencies. Keep the original data separately so the calculation can be repeated. The manual analyzer helps examine that data; it does not replace a table log or verify its accuracy.
For claims about signals from past multipliers, read why past results do not predict multipliers. More data improves the description of the past, not your ability to recover losses.
Only gamble if you meet local age and eligibility requirements. Set a loss budget you can afford and do not increase it to chase losses. You can complete the practice exercise here without gambling at all.
Frequently Asked Questions
No. The practice example on this page requires no account, deposit or real bet. The analyzer works with winning numbers you enter manually.
Invalid tokens are silently ignored. Enter only whole decimal numbers from 0 to 36, separated by commas, spaces, semicolons or line breaks, and check that the counter matches your expected sample size.
The analyzer does not save history or support export. Keep the original sequence separately if you want to use it again.
No. Winning numbers alone do not contain all stakes and settlements. Even an observed returned share calculated from complete financial records is not theoretical RTP.
Evgeniy Volkov
Verified ExpertFullstack developer with a background in mathematics. I build the calculators and game-style tools on ToolsGambling with Pixi.js and modern web tech, and every result uses transparent probability formulas you can verify yourself.