












Contents
Strokes Gained (SG) measures strokes gained or lost relative to a chosen benchmark. It evaluates how much a shot reduces the expected strokes to hole out, after deducting the shot itself. In Mark Broadie’s 2012 example below, the benchmark represents an average PGA TOUR player and depends on both distance and lie—the ball’s location or surface. SG is not par, a golf handicap, or a probability of winning.
SG helps explain how individual shots contribute to a score, rather than showing only the final result. Tournament statistics and other services may apply additional adjustments, so their figures should not be mixed without checking how they were calculated.
How do you calculate Strokes Gained for one shot?
Subtract the expected strokes to hole out after the shot from the expected strokes before it, then subtract one for the shot played.
The benchmark function, J(distance, lie), gives the expected strokes to hole out from a particular position using historical data for the chosen comparison group. It is a conditional average, not a promise about how many strokes an individual golfer will take.
Both distance and lie matter: a ball in the fairway, rough, or on the green can have different expected outcomes. Distance alone is not enough to select a benchmark, and a PGA TOUR benchmark is not a universal reference table for every amateur.
The formula and figures below come from Mark Broadie’s 2012 paper, pages 148–149:
SG of a shot = expected strokes before − expected strokes after − 1
Equivalently: SG = J(before) − J(after) − 1
Strokes Gained calculation: 40 yards from the hole in the fairway with 2.6 expected strokes, finishing one foot away with 1.0 expected strokes; subtracting one shot gives +0.6 SG
Original diagram based on Broadie’s 2012 published teaching example: 40 yards in the fairway to one foot from the hole, expected strokes falling from 2.6 to 1.0, and one shot deducted for +0.6 SG. This is not a ShotLink screenshot or a current player’s tournament shot.
In this published example, the ball starts 40 yards from the hole in the fairway and finishes one foot from the hole.
| Input or result | Value | Meaning |
|---|---|---|
| Starting position | 40 yards, fairway | Distance and lie before the shot |
J(before) | 2.6 | Expected strokes to hole out before the shot |
| Finishing position | One foot from the hole | Position after the shot |
J(after) | 1.0 | Expected strokes to hole out after the shot |
| Strokes played | 1 | The shot that must be deducted |
| SG for the shot | 2.6 − 1.0 − 1 = +0.6 | The shot gained 0.6 strokes against the benchmark |
The calculation uses the published teaching values 2.6 and 1.0 at their stated precision; no additional decimal places are assumed. These are not values chosen for an arbitrary shot or observations from a live tournament.
The positive result means the golfer performed better than the benchmark on this shot. It does not guarantee the same performance on the next shot or in the next tournament.
When every stroke is accounted for, including penalties, summed SG over a complete hole equals the benchmark from the tee minus the actual strokes taken. The intermediate J values cancel, and expected strokes remaining become zero once the ball is holed.
What are the Strokes Gained categories?
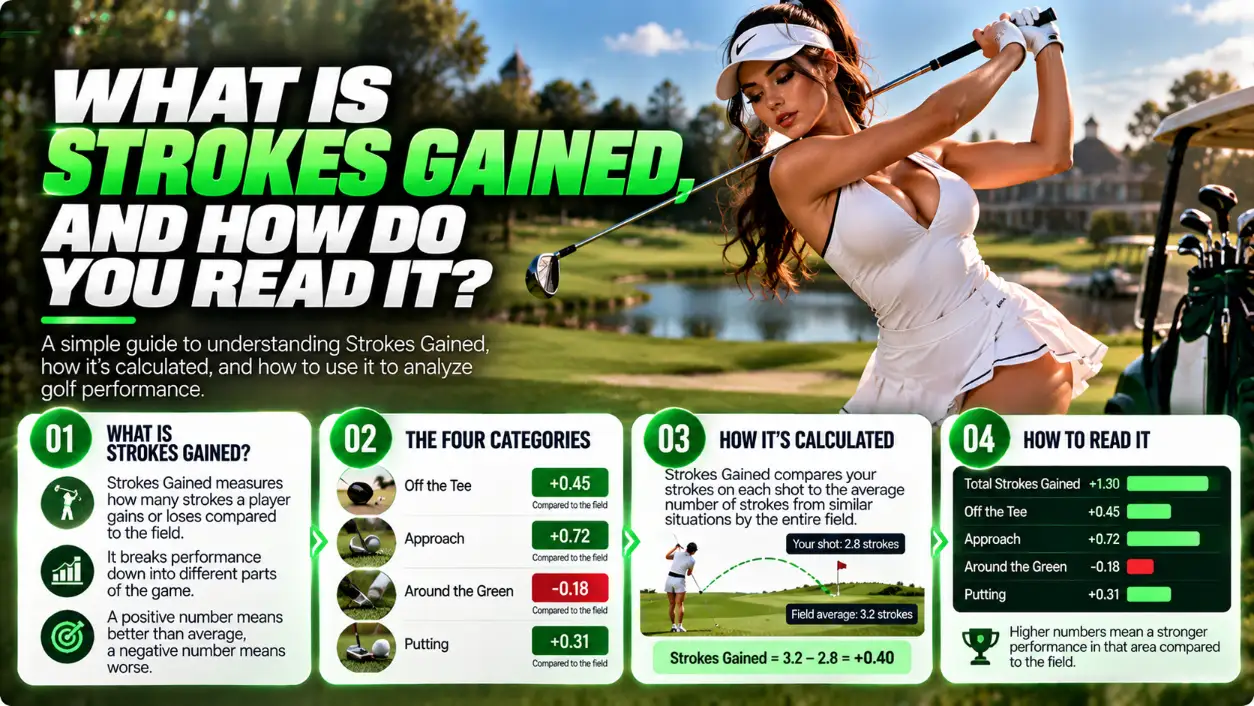
SG separates performance into tee shots, approaches, shots around the green, and putts. Total SG combines those four parts.
The PGA TOUR statistics use these categories:
- Off-the-Tee: tee shots on par-4 and par-5 holes.
- Approach: approach shots, including tee shots on par-3 holes.
- Around-the-Green: short shots near the green that are not putts.
- Putting: strokes played from the green.
- Tee-to-Green: the sum of Off-the-Tee, Approach, and Around-the-Green.
- Total: the sum of all four main categories.
There is no single distance cutoff between Approach and Around-the-Green that applies across all data providers. Check the provider’s classification rules rather than assuming a universal yardage boundary.
The breakdown identifies where a golfer gained or lost strokes. A positive Total alone does not tell you whether the advantage came from tee shots, approaches, short-game shots, or putting.
How should you compare two golfers using SG?
Compare golfers only after checking the benchmark, units, and amount of measured data. Two figures labeled “+1.0” do not necessarily describe equivalent performances.
+1.0 SG per round means an average advantage of one stroke against the benchmark for each measured round. A tournament total combines all included rounds. An average and a total cannot be compared directly without accounting for the number of rounds.
| What to check | Requirement for a fair comparison | Why it matters |
|---|---|---|
| Source and benchmark | Use the same source and comparison benchmark | A different benchmark changes what the advantage means |
| Units | Compare per-round averages with averages, or tournament totals with totals | Averages and totals answer different questions |
| Period and sample size | Identify the dates and number of measured rounds | A short sample provides less evidence of sustained performance |
| Measurement coverage | Check which rounds and shots were included | Missing measurements must not be treated as zero SG |
| Tournament context | Account for field strength and playing conditions | Results depend on the competition and its conditions |
Provider differences can be substantive. The Data Golf FAQ distinguishes raw SG relative to the tournament field average from field-strength-adjusted “true” SG. The tournament field means the participating golfers, not the course. Even figures covering the same dates may therefore differ between providers.
Hypothetical comparison—not actual player data: Player A averages +1.2 SG per round over 8 measured rounds, while Player B averages +0.8 over 40 measured rounds, using a common benchmark.
A’s observed mean is 0.4 strokes per round higher. That does not establish a higher, more stable skill level or predict a win, particularly given the smaller sample. The supported conclusion is limited to the difference between these two observed averages.
Can SG tell you the probability of winning a bet?
No. Historical SG can be an input to a predictive model, but it does not by itself provide a future win probability or establish a profitable bet.
A forecast needs estimates of future performance and its uncertainty, along with the opponents, competition format, and conditions. For example, Data Golf’s predictive methodology describes modeling future performance distributions for all golfers and simulating finishing positions. This is one modeling approach, not the only method or proof that any resulting forecast is accurate.
Only after estimating the probability of a specific outcome can you compare it with the offered odds and market rules. Positive SG alone does not establish positive expected value (EV).
To check the implied probability of a price separately:
- Open the implied probability calculator.
- Select Decimal.
- Clear the list so that only one outcome remains.
- Enter
5.00in the odds field. - Read the result:
20%.
Here, 1/5 = 20% is the implied probability from the odds—a price threshold. It is not a model forecast or a true win probability inferred from SG. Bookmaker odds can include a margin; converting them to implied probability does not remove that margin or reveal the true chance.
The calculator does not calculate SG or turn it into a win probability. Do not enter an invented value in the field for your own probability estimate: assessing betting expected value requires a justified probability for the outcome as well as the price.
Frequently Asked Questions
Yes. Par and SG use different benchmarks. A score under par can still be worse than the expected score for the chosen comparison group, producing negative SG.
If the benchmark is amateurs at a particular handicap level, SG measures performance relative to that group, not the average PGA TOUR player. Values calculated against different benchmarks are not directly interchangeable.
Evgeniy Volkov
Verified ExpertFullstack developer with a background in mathematics. I build the calculators and game-style tools on ToolsGambling with Pixi.js and modern web tech, and every result uses transparent probability formulas you can verify yourself.