












Contents
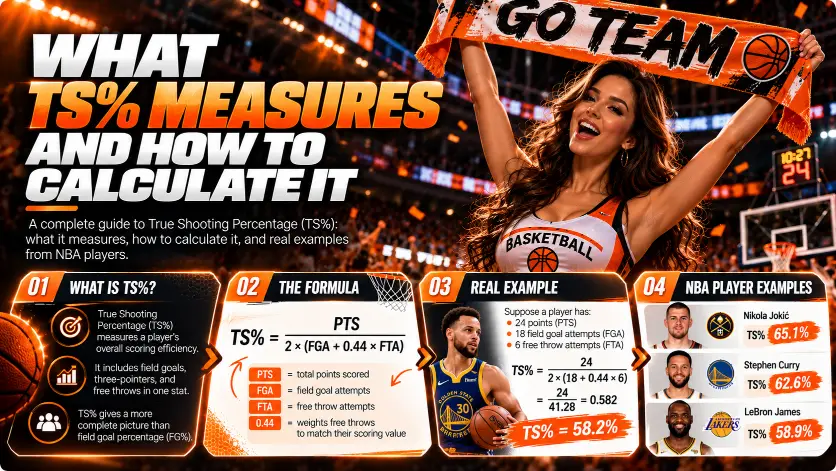
True shooting percentage (TS%) measures scoring efficiency across two-pointers, three-pointers and free throws. Calculate it with TS% = PTS / [2 × (FGA + 0.44 × FTA)] × 100%: points divided by twice the estimated true shooting attempts, expressed as a percentage. TS% describes efficiency over a historical sample; it does not tell you the probability that a player will go Over their next points total.
How to calculate TS% from a box score
You need three numbers from the same game or statistical period: points, field goal attempts and free throw attempts. The NBA Stats glossary provides the TS% formula and definitions.
| Abbreviation | What to use | What not to confuse it with |
|---|---|---|
| PTS | Points scored | The number of made shots |
| FGA | Field goal attempts, including both two-point and three-point attempts | Field goals made; missed attempts count too |
| FTA | Free throw attempts | Free throws made; missed attempts count too |
To calculate TS%:
- Multiply free throw attempts by
0.44. - Add field goal attempts to get estimated true shooting attempts.
- Double that result.
- Divide points by the result, then multiply by
100%.
Here is an illustrative stat line, not a real player's game:
| Input | Value |
|---|---|
| Two-pointers made | 8 |
| Three-pointers made | 2 |
| Free throws made | 3 |
| Field goal attempts | 16 |
| Free throw attempts | 6 |
First, check the scoring: 8 × 2 + 2 × 3 + 3 = 25 points. The player made 10 of 16 field goal attempts and 3 of 6 free throw attempts.
| Step | Calculation |
|---|---|
| Estimated true shooting attempts | 16 + 0.44 × 6 = 18.64 |
| Twice the estimated attempts | 2 × 18.64 = 37.28 |
| TS% | 25 / 37.28 × 100% = 67.060…% |
| Rounded result | 67.1% |
TS% is rounded to one decimal place here; intermediate values are not rounded. The result applies only to this constructed stat line. It is neither a forecast for the next game nor the probability of making an individual shot.
What do 0.44 and the factor of 2 mean?
The 0.44 factor converts free throw attempts into an estimated contribution to shooting attempts, while multiplying by 2 puts the calculation on a two-point scoring scale. Both are parts of the standard formula, not player-specific settings.
Free throws occur in different situations and sequences, so each free throw attempt cannot simply be treated as a separate full shooting opportunity. The 0.44 factor is an approximation: it is not a free throw success probability or an exact count of a player's possessions. Likewise, FGA + 0.44 × FTA should not be described as an exact possession count.
The factor of 2 is easiest to understand with an idealized example. If a player attempts only two-pointers, makes every shot and takes no free throws, they score two points per attempt and have a TS% of 100%. This explains the scale; it does not mean TS% can never exceed 100%.
How does TS% differ from FG% and eFG%?
Field goal percentage measures shooting accuracy, effective field goal percentage gives extra weight to three-pointers, and TS% also includes free throws. They answer different questions, so their results need not match.
In the same illustrative stat line, there are 10 field goals made, including 2 three-pointers, from 16 field goal attempts:
| Metric | What it measures | Calculation for the example |
|---|---|---|
| Field goal percentage — FG% | The share of field goal attempts made, treating two-pointers and three-pointers equally | 10 / 16 × 100% = 62.5% |
| Effective field goal percentage — eFG% | Field goal efficiency adjusted for the extra value of three-pointers, excluding free throws | (10 + 0.5 × 2) / 16 × 100% = 68.75% |
| True shooting percentage — TS% | Points from two-pointers, three-pointers and free throws relative to estimated true shooting attempts | 25 / 37.28 × 100% ≈ 67.1% |
These differences are not calculation errors: the metrics use different numerators and denominators. In particular, eFG% excludes free throws, while TS% includes both free throw points and the estimated weight of free throw attempts.
What does TS% tell you about a player points prop?
TS% helps describe scoring efficiency, but a player points total also depends on scoring opportunities. Similar efficiency can produce very different point totals when shot and free throw volume differ.
Compare these two illustrative stat lines:
| Illustrative line | Points | Field goal attempts | Free throw attempts | TS% | Comparison with a 24.5-point line |
|---|---|---|---|---|---|
| A | 25 | 16 | 6 | 67.1% | 25 is Over 24.5 |
| B | 15 | 10 | 3 | 66.3% | 15 is Under 24.5 |
For line B, the calculation is 15 / [2 × (10 + 0.44 × 3)] × 100% ≈ 66.3%. Both TS% values are rounded to one decimal place without rounding intermediate values.
Illustrative comparison: 25 points at 67.1% TS is above a 24.5-point line, while 15 points at 66.3% TS is below it
Illustrative chart, not actual game records or a sportsbook ticket: 25 points meets the condition for Over 24.5 player points; 15 points does not, despite a similar TS%.
This comparison demonstrates the importance of volume. It is only an arithmetic check of two hypothetical totals—not a settled real bet or a forecast.
When using TS% to research a player, consider it alongside:
- The sample period and size. Points and attempts must cover the same period. The size of that sample matters when judging how stable the efficiency might be.
- Minutes and role. Check whether the player's historical opportunities are comparable to their expected workload.
- Field goal and free throw volume. High efficiency alone does not guarantee enough attempts to reach a points total.
- Health and opponent. These are separate inputs that do not appear in the TS% formula.
- The market line and scoring period. Establish the exact points threshold and the period covered by the market.
There is no useful universal cutoff for a “good TS%” without specifying the league, season and player role.
Can you convert TS% into a probability of going Over?
No. TS% does not provide a distribution of future points, so it cannot establish the probability of going Over or Under a player points total. This is a conclusion from the formula and the illustrative comparison above, not a separate NBA rule.
In particular, 67.1% TS does not mean a 67.1% probability of scoring Over 24.5 points. Estimating that probability requires a separate, defensible model of future scoring that accounts for minutes, role and attempt volume. Adding bookmaker odds does not fill that gap.
Odds answer a different question: their implied probability. Open the implied probability calculator, click “Clear” to leave one blank outcome, select “Decimal” if needed, and enter 1.91 in the price field. Read “Implied chance”: 52.36%, from 1 / 1.91, rounded to two decimal places. Leave “Your estimated chance (optional)” blank unless you have an independent probability model; never enter 67.1% TS there. The tool neither calculates TS% nor estimates the probability of a player's future points total.
Use TS% to describe historical scoring efficiency and attempt volume to assess scoring opportunities. Evaluate future outcome probabilities and market prices separately. Neither a high TS% nor a comparison between TS% and implied probability establishes positive expected value.
Evgeniy Volkov
Verified ExpertFullstack developer with a background in mathematics. I build the calculators and game-style tools on ToolsGambling with Pixi.js and modern web tech, and every result uses transparent probability formulas you can verify yourself.