












Contents
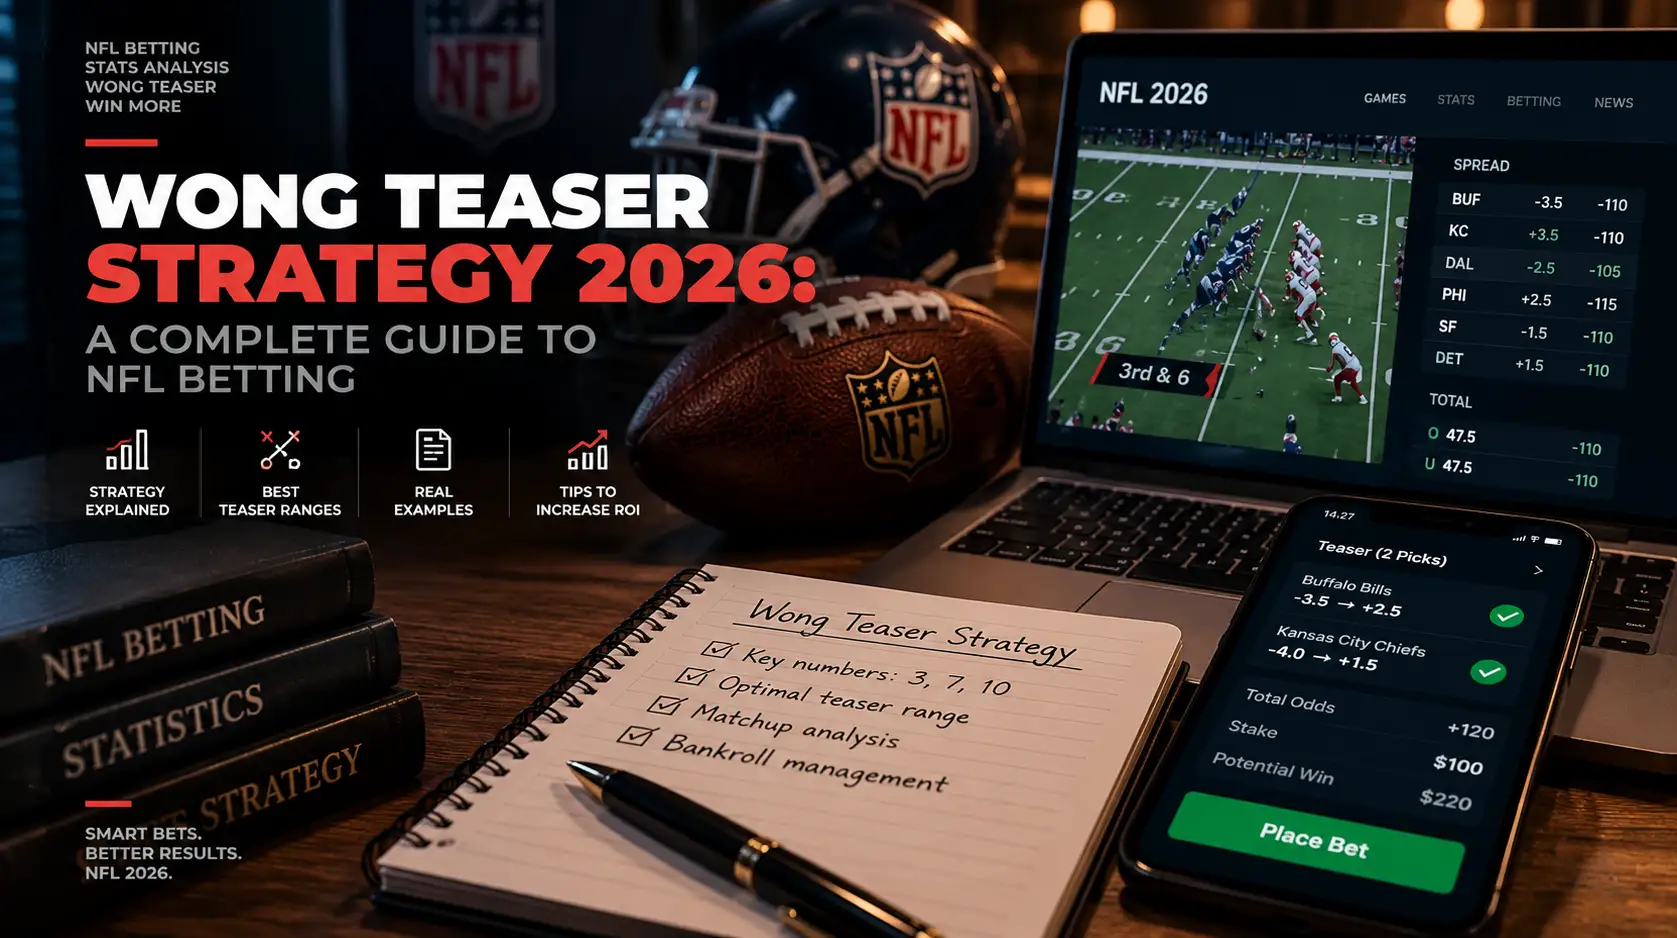
A Wong teaser is a named NFL point spread selection pattern, associated with Stanford Wong, traditionally used for a two-team, six-point teaser that moves each leg through margins of 3 and 7. Matching the pattern alone does not prove profitability. That requires the price of the whole ticket, a valid estimate of its joint winning probability, and the sportsbook’s settlement rules. No current validated winning probability is supplied here.
A teaser is a parlay-style wager: multiple legs are combined into one ticket, with point spreads moved in the bettor’s favor in exchange for a reduced payout. This guide covers the traditional two-team, six-point version, not every teaser format. For the basic mechanics, see what a teaser bet is.
How does a six-point Wong teaser change the point spreads?
A six-point teaser adds six points to each selected team’s point spread: -7.5 becomes -1.5, while +2.5 becomes +8.5. It changes the condition for winning that leg, not the actual score of the game.
The traditional Wong selection pattern is often described as favorites around -7.5 to -8.5 and underdogs around +1.5 to +2.5. This is a named strategy description, not an NFL rule, a universal market standard, or a guarantee of an edge. Wizard of Odds provides a historical treatment, but that historical analysis does not establish present-day profitability.
| Team | Original point spread | After a six-point adjustment | Effect on the leg |
|---|---|---|---|
| Favorite | -7.5 | -1.5 | Winning by 3 or 7 now wins the leg |
| Underdog | +2.5 | +8.5 | Losing by 3 or 7 now wins the leg |
In the favorite example, -7.5 requires a win by at least 8 points; -1.5 requires a win by at least 2. In the underdog example, +2.5 allows a loss by no more than 2 points; +8.5 allows a loss by no more than 8.
“Crossing” 3 and 7 means moving the point spread past those settlement margins so that results at those margins change from losing to winning. These examples show how the qualifying outcomes expand; they do not estimate how likely either leg—or the whole ticket—is to win.
Why are margins of 3 and 7 discussed?
Margins of 3 and 7 matter structurally because an NFL field goal scores 3 points, a touchdown scores 6, and a post-touchdown try scores 1 or 2. A touchdown followed by a successful one-point try therefore produces 7 points. These scoring values are specified in NFL Rulebook Rule 11, accessed October 7, 2026.
In point spread discussions, a “key number” means a recurring NFL scoring margin relevant to settlement. However, scoring rules explain why 3 and 7 arise; they do not establish how frequently modern games finish at either margin.
Crossing those margins increases the set of results that wins an individual leg. Whether that improvement justifies the reduced payout cannot be determined from the point spreads alone.
What break-even win rate does the whole ticket need?
At American odds of -110, -120, and -130, the whole ticket’s break-even win rate is 52.38%, 54.55%, and 56.52%, respectively. These are price-based thresholds, not measured or estimated teaser winning probabilities.
For an ordinary win/loss payoff:
Ticket break-even win rate = risk / (risk + net profit if the ticket wins)
At negative American odds -x, this becomes:
x / (x + 100)
| American odds for the whole ticket | Ticket break-even win rate | Conditional per-leg break-even win rate* |
|---|---|---|
| -110 | 52.38% | 72.37% |
| -120 | 54.55% | 73.85% |
| -130 | 56.52% | 75.18% |
* The final column applies only if the two legs are equally likely and independent. If each leg has probability p, their joint winning probability is p × p. The conditional per-leg threshold is therefore the square root of the ticket threshold. These figures are mathematical illustrations, not observed or estimated team probabilities.
For example, at a hypothetical price of -120, the risk is 100 in net profit. A winning ticket returns $220, including the original stake:
120 / (120 + 100) = 54.55%
All percentages are rounded to two decimal places. This example assumes ordinary win/loss settlement, with no pushes, void legs, or other settlement adjustments. Different grading rules may require a different calculation.
How do you check the ticket price in the implied probability tool?
The implied probability tool converts a hypothetical ticket price of -120 into 54.55% implied probability. That is the whole ticket’s price hurdle, not the probability that the teaser will win.
- Open the implied probability tool.
- Choose American odds.
- Remove the second outcome row so only one input row remains. Use that single row for the hypothetical teaser ticket price.
- Enter the hypothetical price
-120. - Read 54.55% as the implied probability. If the decimal conversion is rendered, it shows 1.83.
The single row represents the price of the entire teaser ticket, not one team’s leg. Do not enter the two teams separately: this tool converts odds; it does not construct a teaser.
Hypothetical -120 ticket price entered in the English implied probability tool
English localhost capture with -120 entered as a hypothetical price for the whole ticket.
Result for hypothetical -120 American odds showing 54.55% implied probability and decimal odds of 1.83
English localhost result: 54.55% is the ticket price hurdle, not an estimated teaser winning probability; 1.83 is the rounded decimal conversion.
These screenshots were captured on localhost on October 7, 2026. They do not establish production availability or validation of the public interface.
Implied probability comes from the quoted price. It is not automatically the actual event probability or a no-vig fair estimate. Likewise, 1.83 is a conversion of the input price, not an independently established fair price.
What is needed to assess present-day profitability?
Assessing positive expected value (EV) requires a valid estimate of the probability that both legs win, together with the actual payoff and settlement rules. A qualifying point spread pattern and a single ticket quote are not enough.
Under the hypothetical -120 price and ordinary win/loss payoff above, positive expected value requires a joint winning probability above the ticket’s 54.55% break-even win rate. No current validated joint probability is available here. Neither the price-derived 54.55% nor the conditional 73.85% per-leg illustration supplies that estimate.
An assessment would need:
- The quoted price for the entire two-team teaser.
- An independently justified estimate of the probability that both legs win.
- An allowance for any dependence between the legs.
- The sportsbook’s current permitted teaser sizes and point adjustments.
- Current house rules for pushes, void legs, and resulting payouts.
The implemented tool cannot model point spread crossing, game probability, individual-leg probability, correlation, sportsbook settlement, or teaser expected value. It converts American odds into implied probability and a decimal equivalent. That helps identify the price hurdle, but it cannot establish whether a particular ticket exceeds it.
Frequently Asked Questions
The pattern described here concerns NFL point spreads and its scoring structure. The same point spread ranges and significance of margins of 3 and 7 cannot be transferred to other sports without separate evidence.
No. The traditional pattern identifies qualifying ranges for favorites and underdogs; it does not require pairing one of each. The table shows two separate examples of point spread adjustments, not a proposed ticket.
Settlement depends on the sportsbook’s current teaser rules. Check how it handles a push, a void leg, and any resulting change to the ticket or payout. The break-even examples here assume ordinary win/loss settlement and do not account for those cases.
No. Those conditional thresholds apply only to two equally likely, independent legs. The ticket’s price still determines its break-even win rate, but evaluating a three-team teaser requires the joint probability that all three legs win and the applicable settlement rules.
Evgeniy Volkov
Verified ExpertFullstack developer with a background in mathematics. I build the calculators and game-style tools on ToolsGambling with Pixi.js and modern web tech, and every result uses transparent probability formulas you can verify yourself.